Estimate Cyclic Trend of Gene Expression Using Trendfiltering
Source:R/fit_cyclic_one.R
fit_trendfilter.RdEstimate Cyclic Trend of Gene Expression Using Trendfiltering
fit_trendfilter(yy, polyorder = 2)
Arguments
| yy | A vector of gene expression values for a single gene. They must be ordered by cell cycle phase. Also, the expression values should be normalized and transformed to standard normal distribution. |
|---|---|
| polyorder | Degree of polynomials used in nonparamtric trend filtering. |
Value
A list with two elements: trend.yy, the estimated
cyclic trend; pve, proportion of variance in gene expression
levels explained by the cyclic trend.
Details
We applied quadratic (second-order) trend filtering using
the trendfilter function in the genlasso package. The
trendfilter function implements a nonparametric smoothing method
which chooses the smoothing parameter by cross-validation and fits
a piecewise polynomial regression.
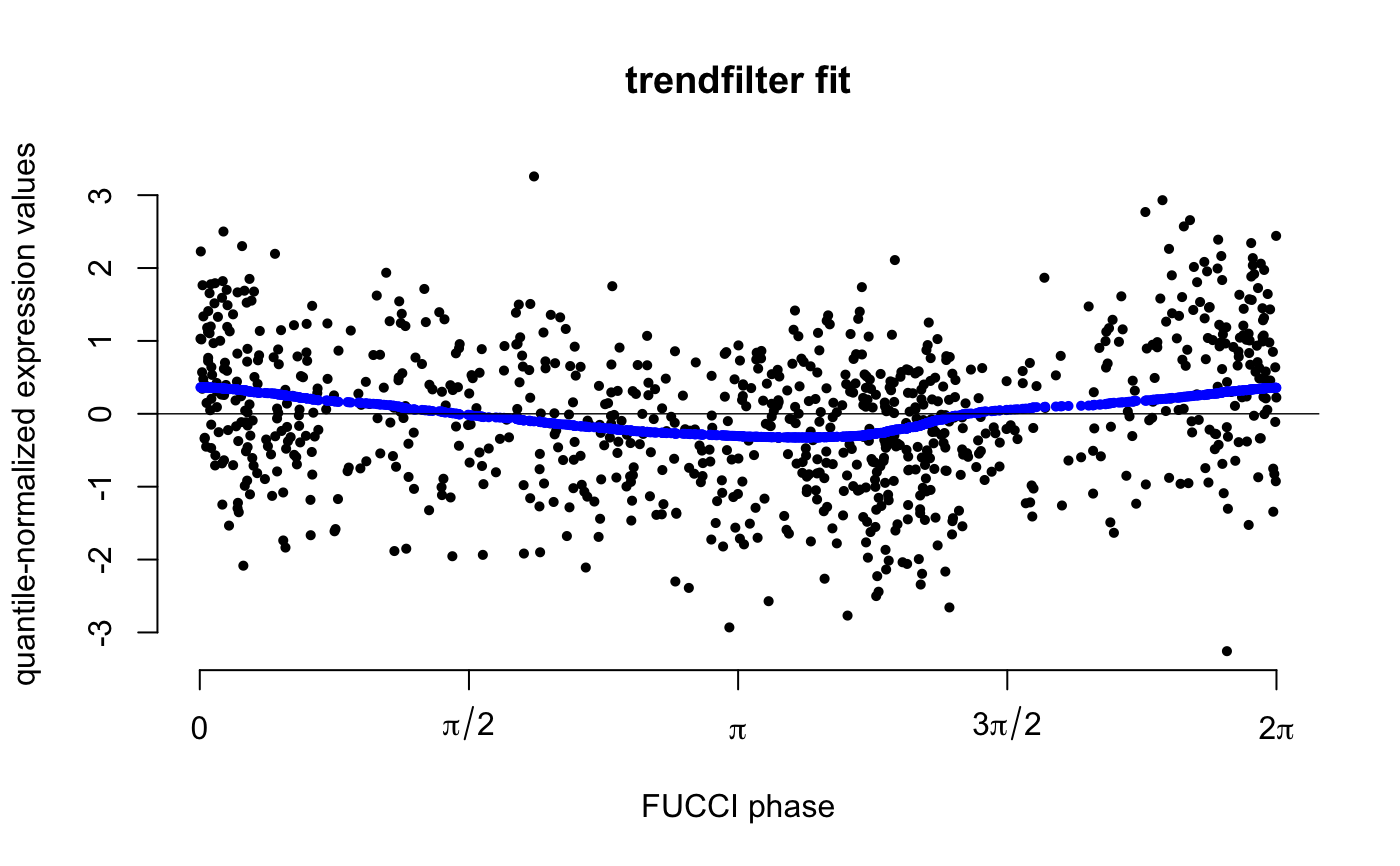
The trendfilter method determines the folds in cross-validation in a non-random manner: every k-th data point in the ordered sample is placed in the k-th fold, so the folds contain ordered subsamples. We applied five-fold cross-validation and chose the smoothing penalty using the option lambda.1se; among all possible values of the penalty term, the largest value such that the cross-validation standard error is within one standard error of the minimum. Furthermore, we desired that the estimated expression trend be cyclical. To encourage this, we concatenated the ordered gene expression data three times, with one added after another. The quadratic trend filtering was applied to the concatenated data series of each gene.
Examples
library(SingleCellExperiment) data(sce_top101genes) # select top 10 cyclic genes sce_top10 <- sce_top101genes[order(rowData(sce_top101genes)$pve_fucci, decreasing=TRUE)[1:10],] coldata <- colData(sce_top10) # cell cycle phase based on FUCCI scores theta <- coldata$theta names(theta) <- rownames(coldata) # normalize expression counts sce_top10 <- data_transform_quantile(sce_top10, ncores=2)#>exprs_quant <- assay(sce_top10, "cpm_quantNormed") # order FUCCI phase and expression theta_ordered <- theta[order(theta)] yy_ordered <- exprs_quant[1, names(theta_ordered)] fit <- fit_trendfilter(yy_ordered)#> Fold 1 ... Fold 2 ... Fold 3 ... Fold 4 ... Fold 5 ...plot(x=theta_ordered, y=yy_ordered, pch=16, cex=.7, axes=FALSE, ylab="quantile-normalized expression values", xlab="FUCCI phase", main = "trendfilter fit")axis(2)axis(1,at=c(0,pi/2, pi, 3*pi/2, 2*pi), labels=c(0,expression(pi/2), expression(pi), expression(3*pi/2), expression(2*pi)))
