Stacked bar plots
JNP
Warning in as.POSIXlt.POSIXct(Sys.time()): unknown timezone 'zone/tz/2017c.
1.0/zoneinfo/America/Chicago'
Last updated: 2018-02-14
Code version: 5b4420c
\(~\)
Packages
library(knitr)
library(kableExtra)
library(dplyr)
library(reshape)
library(metagenomeSeq)
library(ggplot2)
\(~\)
Data
load("../data/nasal_GOM.rdata")
MRobj
MRexperiment (storageMode: environment)
assayData: 553 features, 197 samples
element names: counts
protocolData: none
phenoData
sampleNames: EM0042 EM0047 ... E0168 (197 total)
varLabels: StudyID age ... GOM (95 total)
varMetadata: labelDescription
featureData
featureNames: denovo6 denovo17 ... denovo42992 (4423 total)
fvarLabels: Kingdom Phylum ... Species (7 total)
fvarMetadata: labelDescription
experimentData: use 'experimentData(object)'
Annotation: \(~\)
Functions
grabGroupedMeans <- function(obj,phenotype_name,lvl,...){
    meansOfMeans <- function(x) colMeans(prop.table(as.matrix(x),1))
    if(length(phenotype_name)==1) pd = pData(obj)[,phenotype_name]
    else pd = phenotype_name
    mat= aggTax(obj,lvl=lvl,out='matrix')
    pd = factor(pd)

    groupMeans = by(t(mat),pd,meansOfMeans,simplify=TRUE)
    groupedMeans = do.call("cbind",groupMeans)
    colnames(groupedMeans) = levels(pd)
    groupedMeans
}

plotBar <- function(obj, lvl, cl=colnames(obj), n=10, norm=FALSE, log=FALSE, ord=FALSE, orderby='Other',...){
    if (class(obj) == "MRexperiment") {
        mat = MRcounts(obj, norm = norm, log = log)
        if(length(lvl)==1){
            lvl = fData(obj)[,lvl]
        }
    }
    else if (class(obj) == "matrix") {
        mat = obj
    }
    else {
        stop("Object needs to be either a MRexperiment object or matrix")
    }
    prop = prop.table(mat,2)
    aggProp = aggregateByTaxonomy(prop,lvl,out='matrix')
    ordIndex  = order(rowSums(aggProp),decreasing=TRUE)[1:n]
    Other = 1-colSums(aggProp[ordIndex,])
    aggPropSub = cbind(t(aggProp[ordIndex,]),Other)
    if(length(unique(cl))!=nrow(aggPropSub)){
        cl = factor(cl)
        aggPropSub = by(aggPropSub,cl,colMeans)
        aggPropSub = Reduce("rbind",aggPropSub)
        rownames(aggPropSub) = levels(cl)
        cl = levels(cl)
    }
    propDF = data.frame(Group=cl,aggPropSub)
    if(ord){
        rord = order(aggPropSub[,orderby])
        propDF=propDF[rord,]
        cl = reorder(cl,rord); propDF$Group = cl # ???
    }
    dd = melt(propDF,id.vars=c("Group"),measure.vars=colnames(propDF)[-1])
    p=ggplot(dd,aes(Group,value,fill=variable)) + geom_bar(position="fill", stat='identity') +
    ylab("Proportion") +
    scale_x_discrete(labels = cl,limits=cl)+
    theme(axis.text.x = element_text(angle = 90, hjust = 1)) +
    labs(fill='Taxa')
    return(list(p=p,dd=dd))
}
\(~\)
Sample feature composition by clusters
We display results in stacked bar plots. The vertical bars represent 197 samples grouped by clustering membership. Samples in cluster 1 are on the left, and samples in cluster 2 are on the right. Colors in each vertical bar correspond to different species.
MRobj2 = MRobj2[,order(pData(MRobj2)$GOM)]
grps = grabGroupedMeans(MRobj2,'GOM','Species')
getPalette = colorRampPalette(brewer.pal(12, "Set3"))
tmp= MRobj2[,order(pData(MRobj2)$GOM)]
colnames(tmp) = paste(pData(MRobj2)$GOM,colnames(MRobj2),sep="_")

# pdf("../output/step4_stacked_bar_plots.Rmd/n_taxa_stacked.pdf",width=30,height=10)
# for(i in (c(10,20,30,40)-1)){
#   x = plotBar(tmp,'Species',n=i)
#   y = x$p+ scale_fill_manual(values=getPalette(i+1),guide=FALSE)
#   print(y)
#   y = x$p+ scale_fill_manual(values=getPalette(i+1))
#   print(y)
# }
# dev.off()
9 colors
i=9
#for(i in (c(10,20,30,40)-1)){
x = plotBar(tmp,'Species',n=i)
y = x$p+ scale_fill_manual(values=getPalette(i+1),guide=FALSE)
print(y)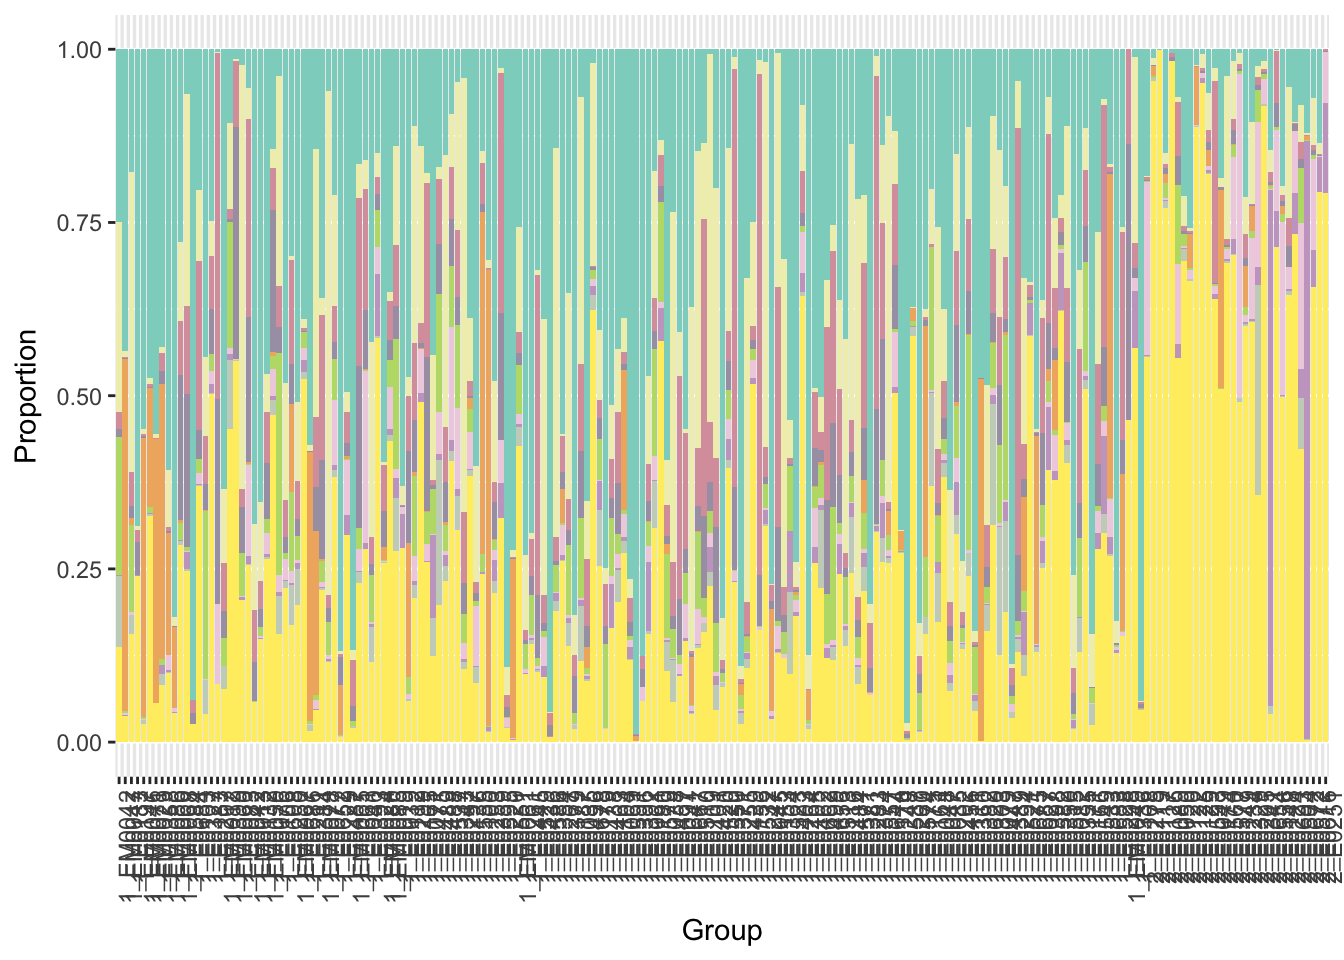
y = x$p+ scale_fill_manual(values=getPalette(i+1))
print(y)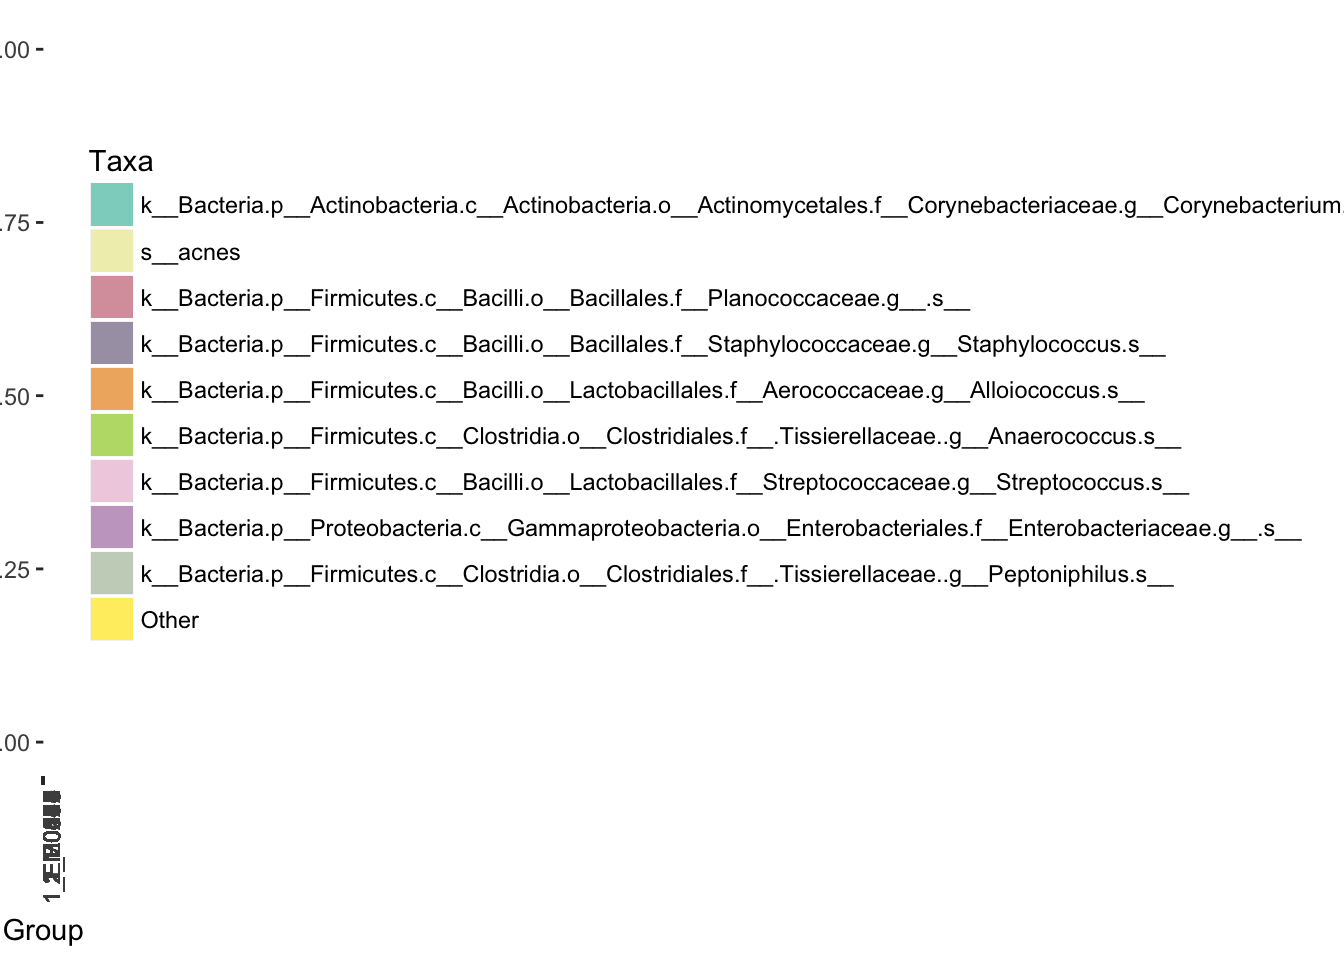
#}19 colors
i=19
#for(i in (c(10,20,30,40)-1)){
x = plotBar(tmp,'Species',n=i)
y = x$p+ scale_fill_manual(values=getPalette(i+1),guide=FALSE)
print(y)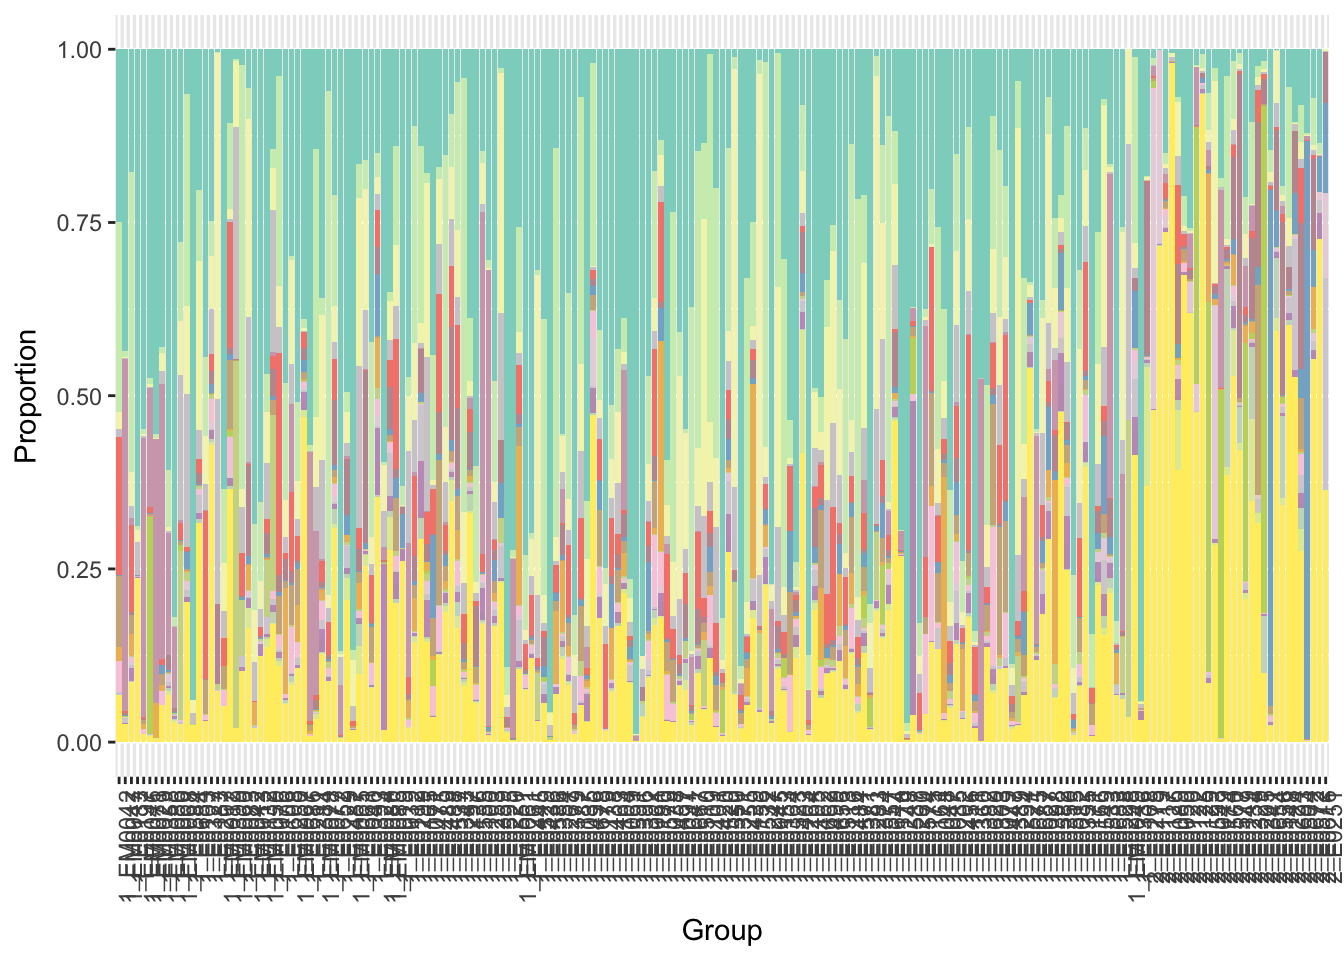
y = x$p+ scale_fill_manual(values=getPalette(i+1))
print(y)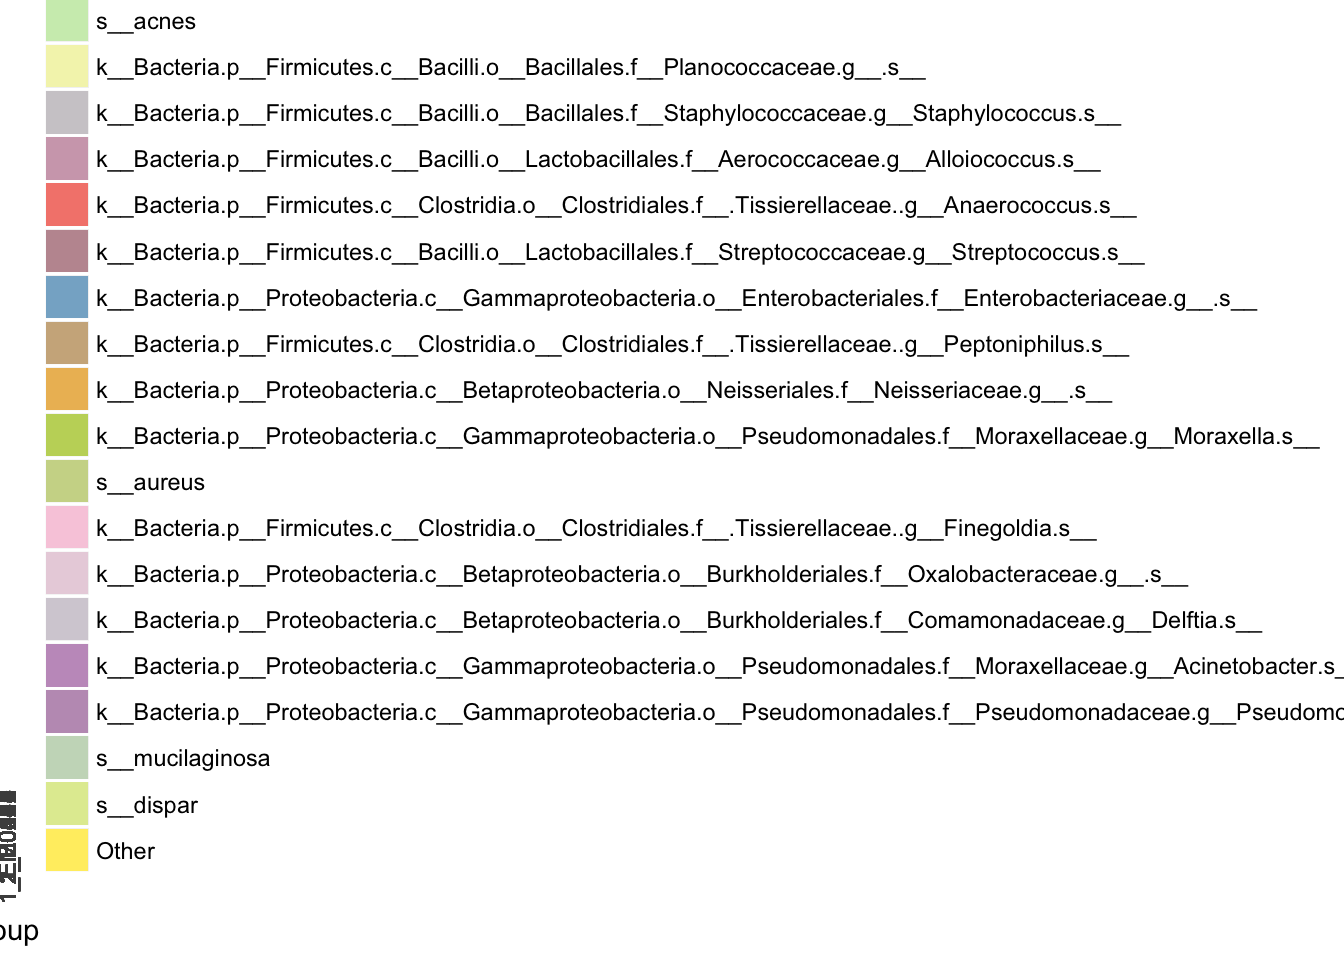
#}29 colors
i=29
#for(i in (c(10,20,30,40)-1)){
x = plotBar(tmp,'Species',n=i)
y = x$p+ scale_fill_manual(values=getPalette(i+1),guide=FALSE)
print(y)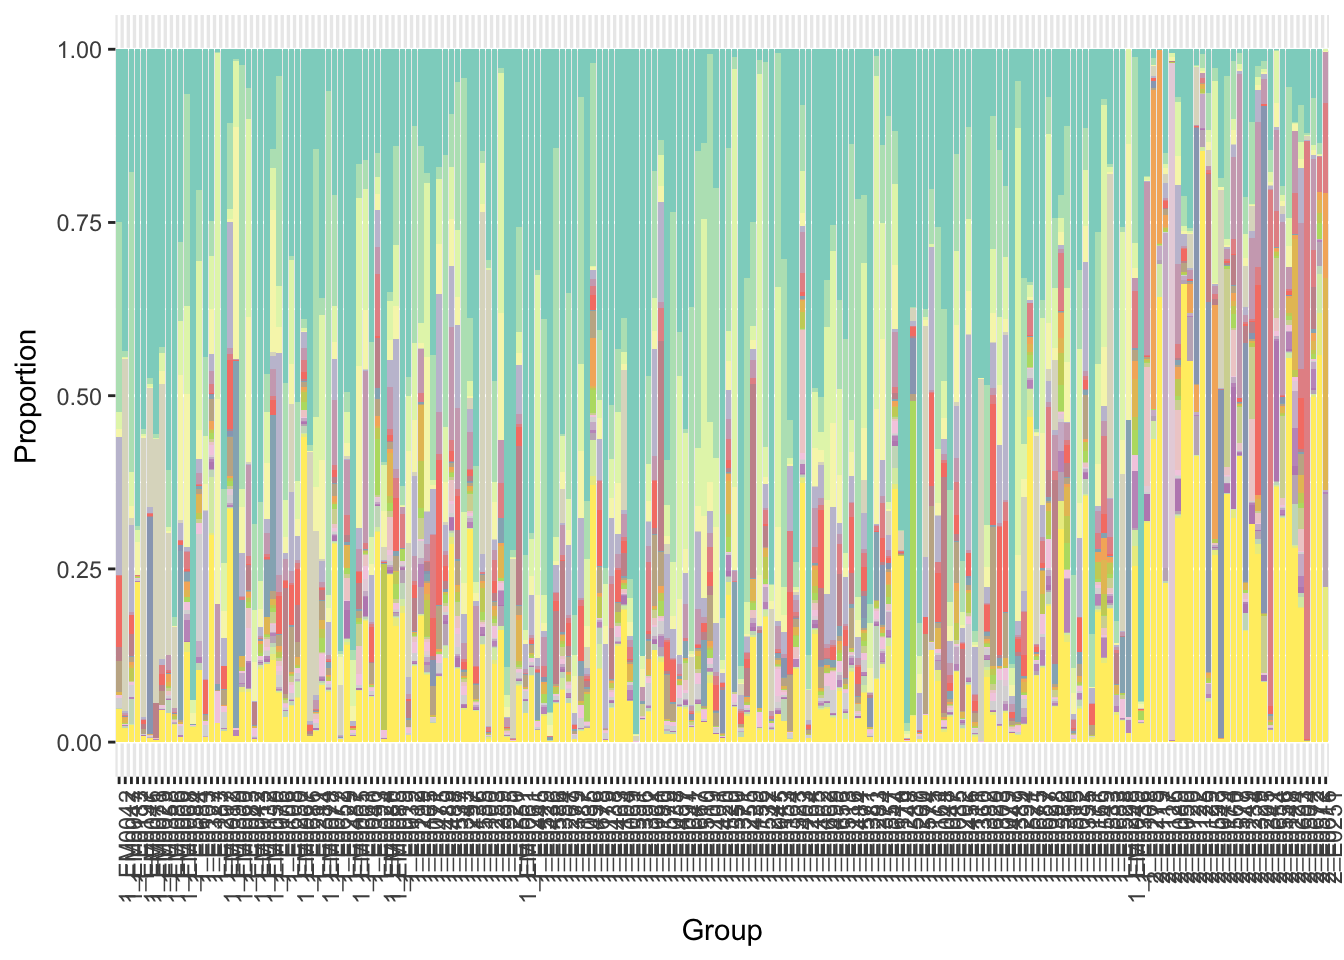
y = x$p+ scale_fill_manual(values=getPalette(i+1))
print(y)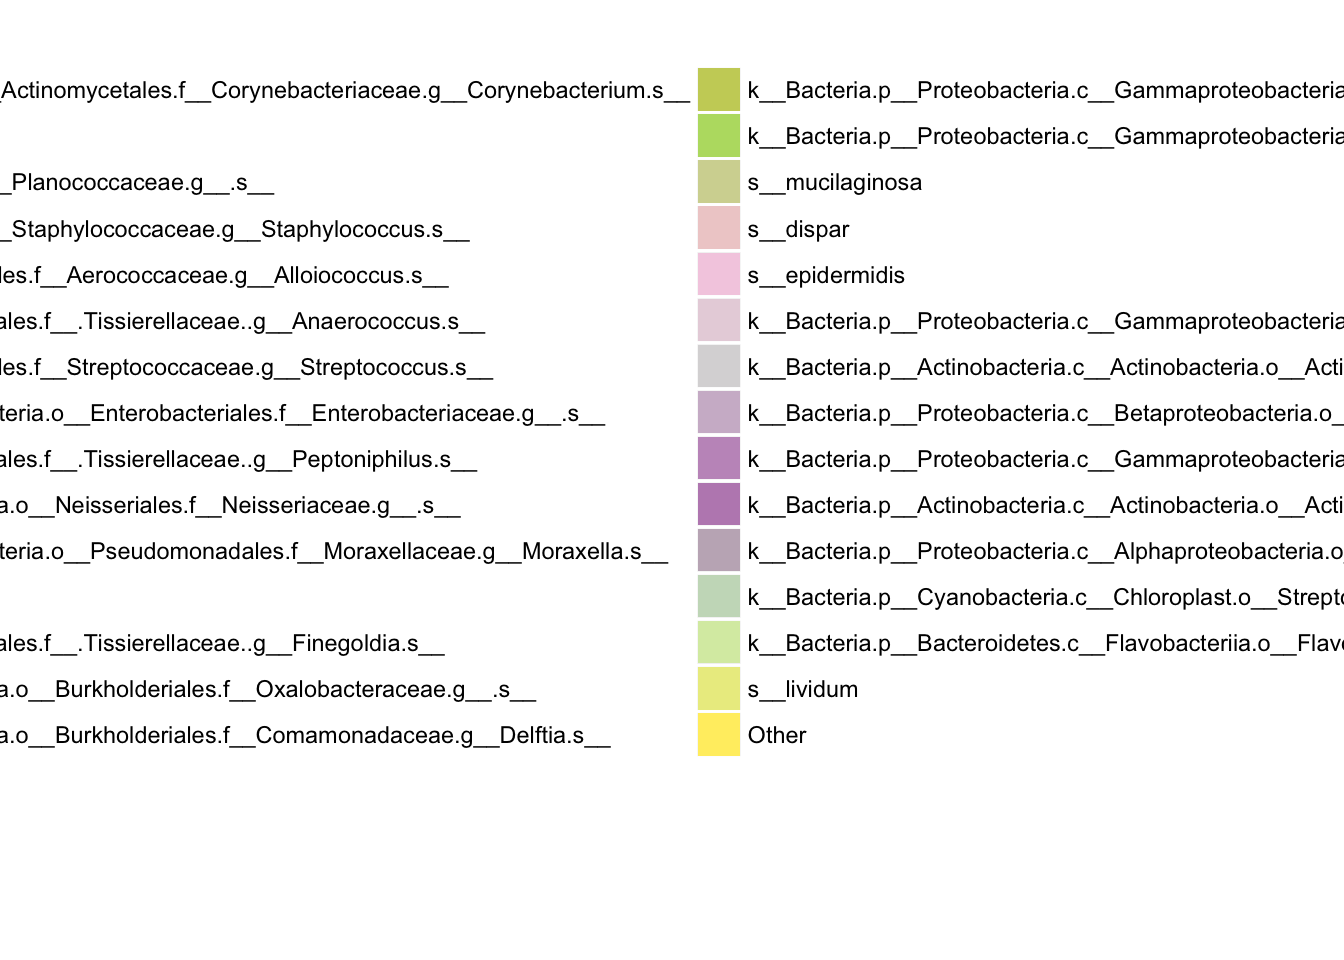
#}39 colors
i=29
#for(i in (c(10,20,30,40)-1)){
x = plotBar(tmp,'Species',n=i)
y = x$p+ scale_fill_manual(values=getPalette(i+1),guide=FALSE)
print(y)
y = x$p+ scale_fill_manual(values=getPalette(i+1))
print(y)
#}Session information
R version 3.4.1 (2017-06-30)
Platform: x86_64-apple-darwin15.6.0 (64-bit)
Running under: macOS High Sierra 10.13

Matrix products: default
BLAS: /Library/Frameworks/R.framework/Versions/3.4/Resources/lib/libRblas.0.dylib
LAPACK: /Library/Frameworks/R.framework/Versions/3.4/Resources/lib/libRlapack.dylib

locale:
[1] en_US.UTF-8/en_US.UTF-8/en_US.UTF-8/C/en_US.UTF-8/en_US.UTF-8

attached base packages:
[1] parallel  stats     graphics  grDevices utils     datasets  methods
[8] base

other attached packages:
 [1] ggplot2_2.2.1        metagenomeSeq_1.20.1 RColorBrewer_1.1-2
 [4] glmnet_2.0-13        foreach_1.4.4        Matrix_1.2-12
 [7] limma_3.34.4         Biobase_2.38.0       BiocGenerics_0.24.0
[10] reshape_0.8.7        dplyr_0.7.4          kableExtra_0.6.1
[13] knitr_1.17

loaded via a namespace (and not attached):
 [1] gtools_3.5.0       lattice_0.20-35    colorspace_1.3-2
 [4] htmltools_0.3.6    viridisLite_0.2.0  yaml_2.1.16
 [7] rlang_0.1.4        glue_1.2.0         bindrcpp_0.2
[10] matrixStats_0.52.2 bindr_0.1          plyr_1.8.4
[13] stringr_1.2.0      munsell_0.4.3      gtable_0.2.0
[16] rvest_0.3.2        caTools_1.17.1     codetools_0.2-15
[19] evaluate_0.10.1    labeling_0.3       Rcpp_0.12.14
[22] KernSmooth_2.23-15 readr_1.1.1        scales_0.5.0
[25] backports_1.1.2    gdata_2.18.0       gplots_3.0.1
[28] hms_0.4.0          digest_0.6.13      stringi_1.1.6
[31] grid_3.4.1         rprojroot_1.2      tools_3.4.1
[34] bitops_1.0-6       magrittr_1.5       lazyeval_0.2.1
[37] tibble_1.3.4       pkgconfig_2.0.1    xml2_1.1.1
[40] assertthat_0.2.0   rmarkdown_1.8      httr_1.3.1
[43] iterators_1.0.9    R6_2.2.2           git2r_0.20.0
[46] compiler_3.4.1
This R Markdown site was created with workflowr