Choosing number of clusters in GoM model
Joyce Hsiao
Warning in as.POSIXlt.POSIXct(Sys.time()): unknown timezone 'zone/tz/2018c.
1.0/zoneinfo/America/Chicago'
Last updated: 2018-06-07
Code version: 852b84b
Background and summar
The GoM (Grades of Membership) model computes log Bayes factor for comparing model fitting with k clusters versus null single cluster model. The log Bayes factor is corrected for the number of parameters fitted in each model. In clustering analysis, one typically chooses k that has the largest Bayes factor. However, it is worth remembering that in practice, it is unlikely to get a true k, and results from different k may complement each other rather than competing with each other.
In the current analysis, we evaluated the data with k = 2 to 20. We found that k=2 produces the largest Bayes factor.
Analysis
library(knitr)
library(kableExtra)
library(dplyr)
library(metagenomeSeq)
library(CountClust)
library(vegan)
Read in filtered data.
MRobj <- readRDS("../data/nasal_filtered_normed_batchcorrected.rds")
counts <- MRcounts(MRobj,norm=FALSE,log=FALSE)

MRobj
MRexperiment (storageMode: environment)
assayData: 553 features, 197 samples
element names: counts
protocolData: none
phenoData
sampleNames: EM0042 EM0047 ... E0168 (197 total)
varLabels: StudyID age ... infnone (94 total)
varMetadata: labelDescription
featureData
featureNames:
k__Bacteria;p__[Thermi];c__Deinococci;o__Deinococcales;f__Deinococcaceae;g__CM44;s__
k__Bacteria;p__[Thermi];c__Deinococci;o__Deinococcales;f__Deinococcaceae;g__Deinococcus;s__
... s__zeae (553 total)
fvarLabels: Kingdom Phylum ... Species (7 total)
fvarMetadata: labelDescription
experimentData: use 'experimentData(object)'
Annotation: Fitting k=2 to 10.
fits <- FitGoM(t(counts), K=c(2:10), tol=0.00001)
saveRDS(fits, file = "../data/gomfits.rds")
Extract sample memberships.
fits <- readRDS(file = "../data/gomfits.rds")

clust_fit_membership <- lapply(fits, function(xx) {
     apply(xx$omega, 1, which.max)
  })

for (i in 1:length(clust_fit_membership)) {
  print(table(clust_fit_membership[[i]]))
}
  1   2
180  17

  1   2   3
166  24   7

 1  2  3  4
88 71 27 11

  1   2   3   4   5
105  68  15   8   1

 1  2  3  4  5  6
73 54 40 17 12  1

 1  2  3  4  5  6  7
75 42 38 29  7  3  3

 1  2  3  4  5  6  7  8
79 48 26 19 12  9  2  2

 1  2  3  4  5  6  7  8  9
76 50 25 19 12  9  2  3  1

 1  2  3  4  5  6  7  8  9 10
79 30 27 16 18 11  7  2  5  2
Log Bayes Facctor
par(mfrow=c(1,2))
plot(bf_species, type = "b", xlab = "Number of clusters",
     ylab = "log Bayes Factor (H1 vs single cluster)", main = "Species")
plot(bf_species_seq, type = "b", xlab = "Number of clusters",
     ylab = "Percent change in log Bayes Factor (k vs k-1)", main = "Species")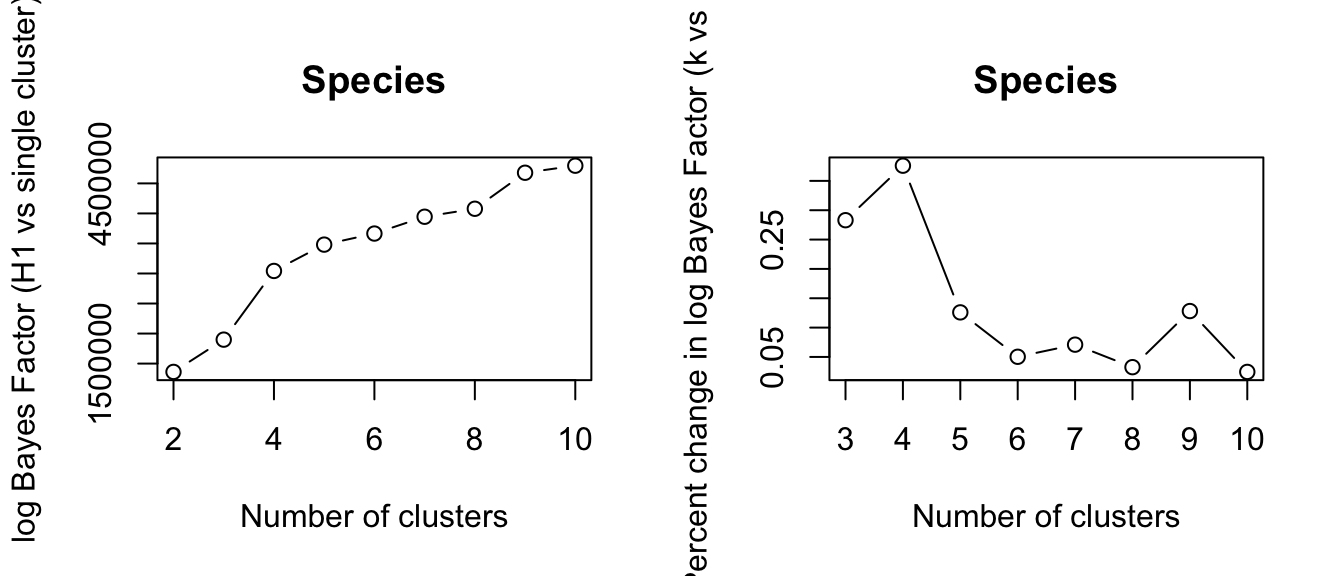
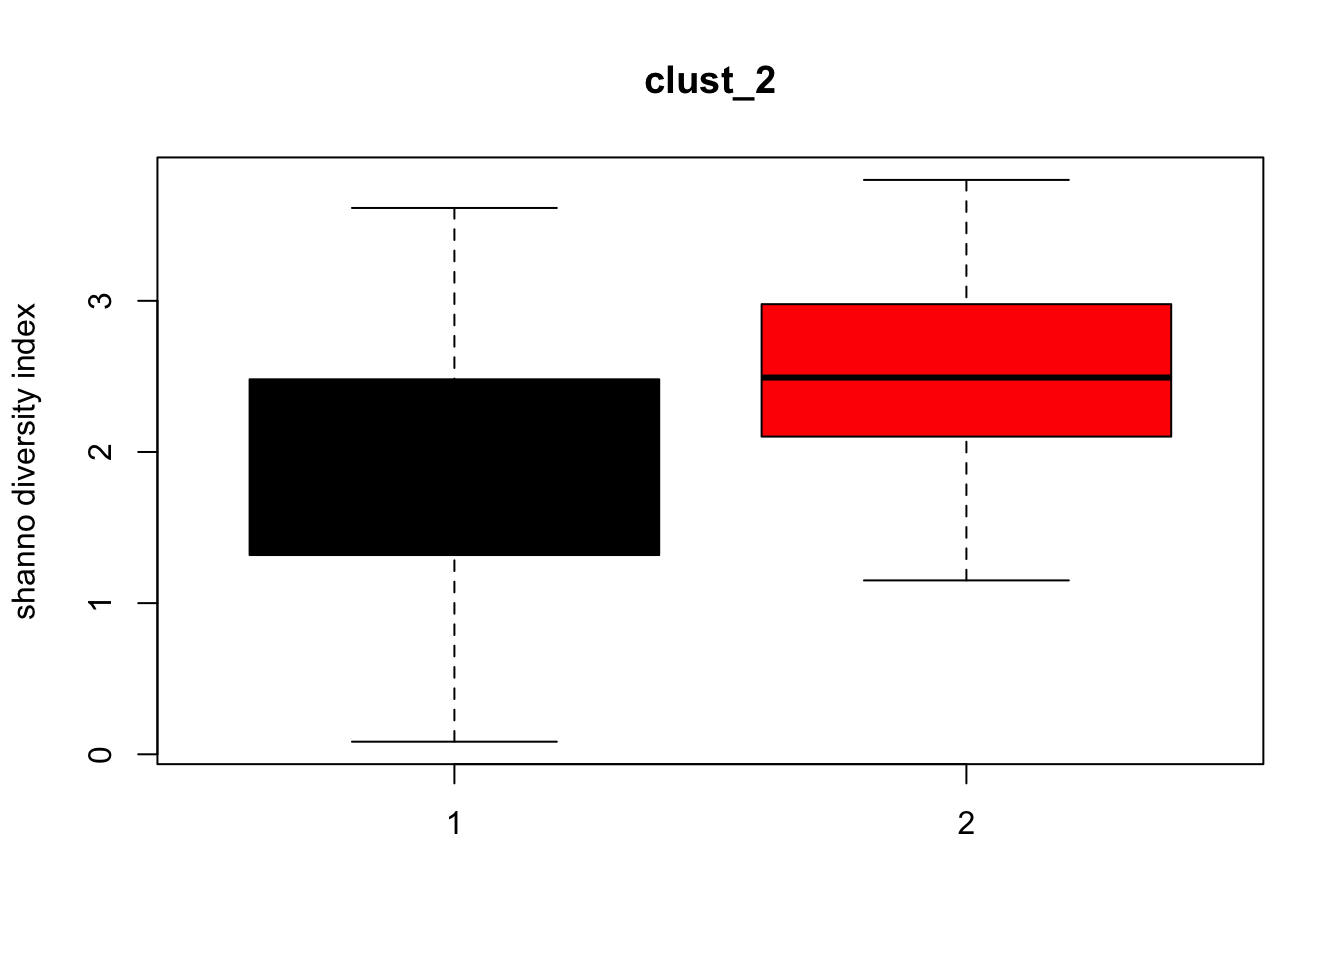
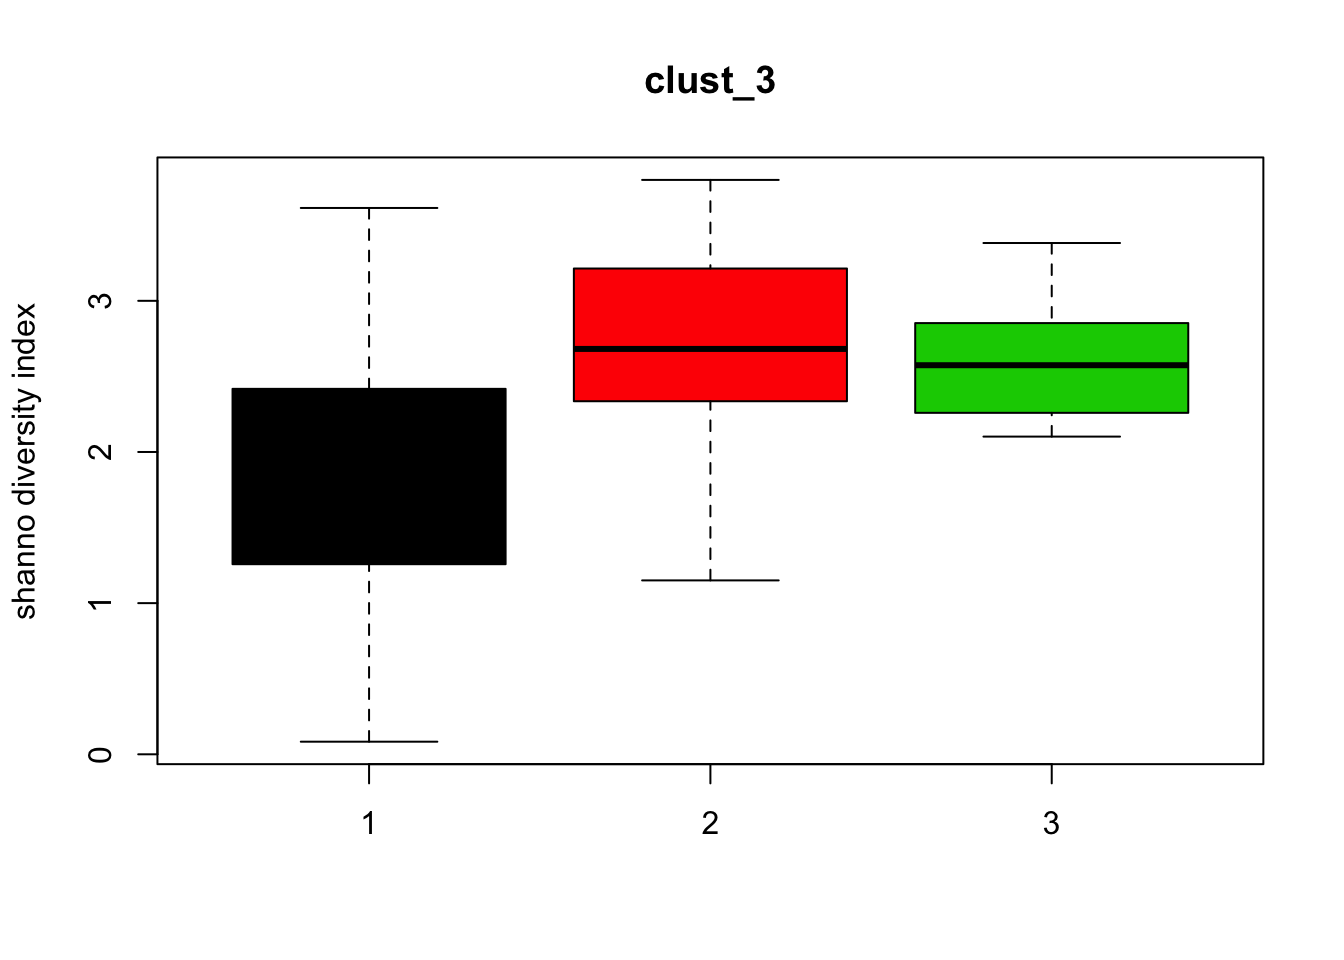
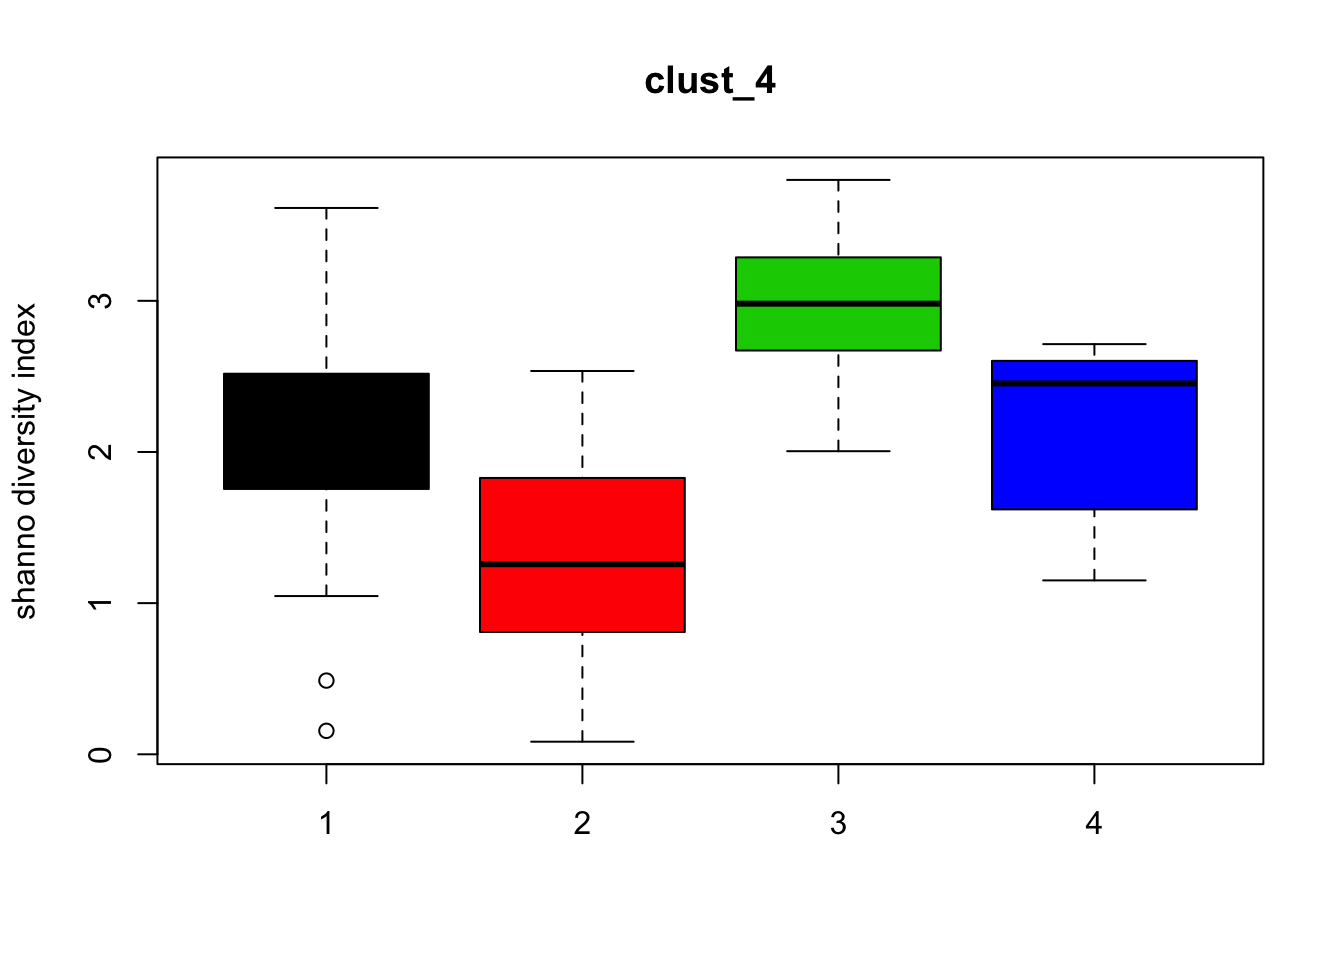
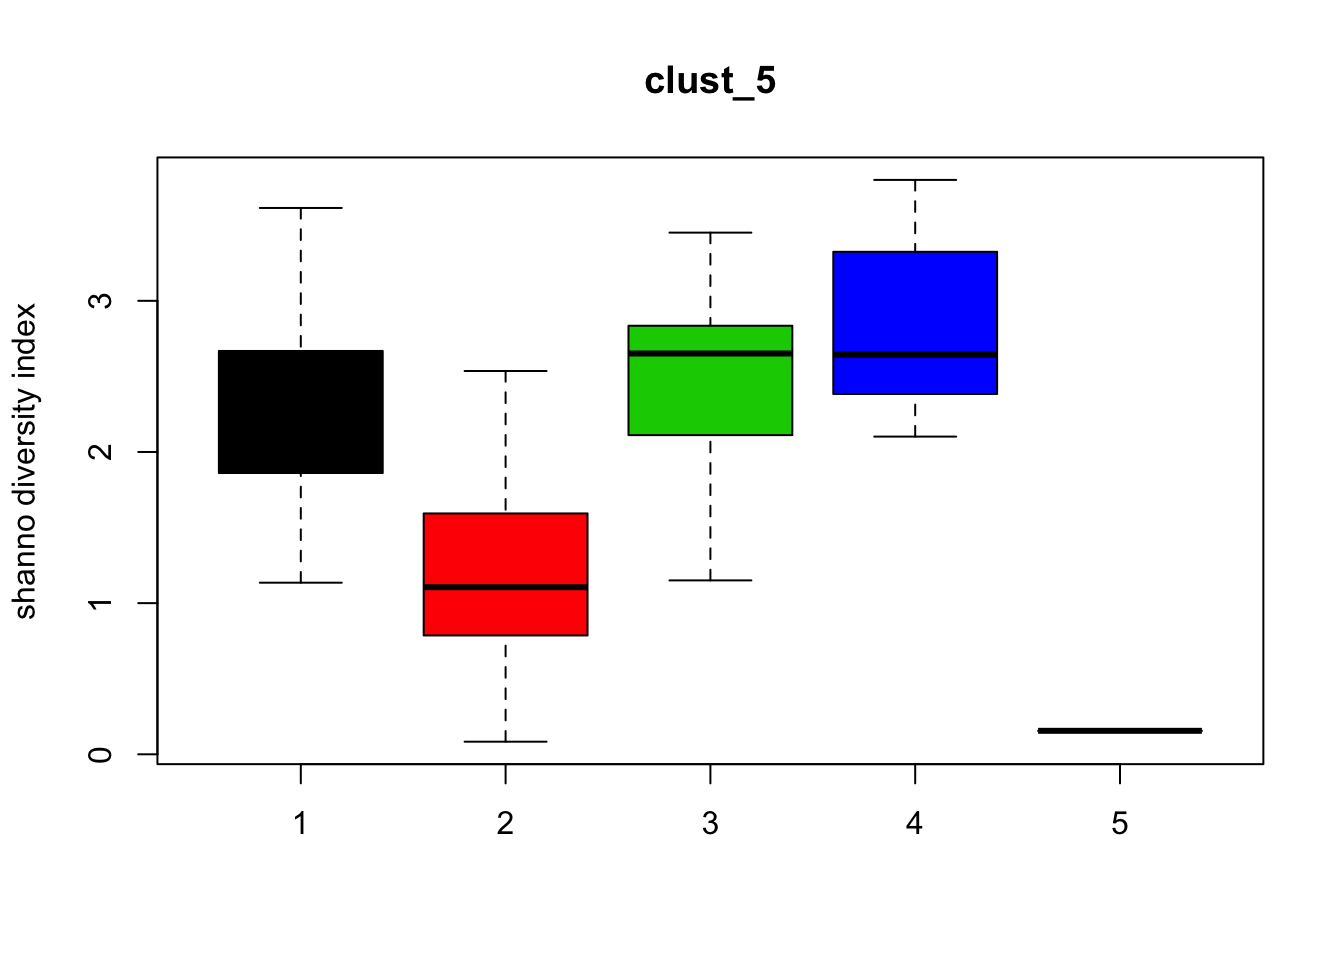
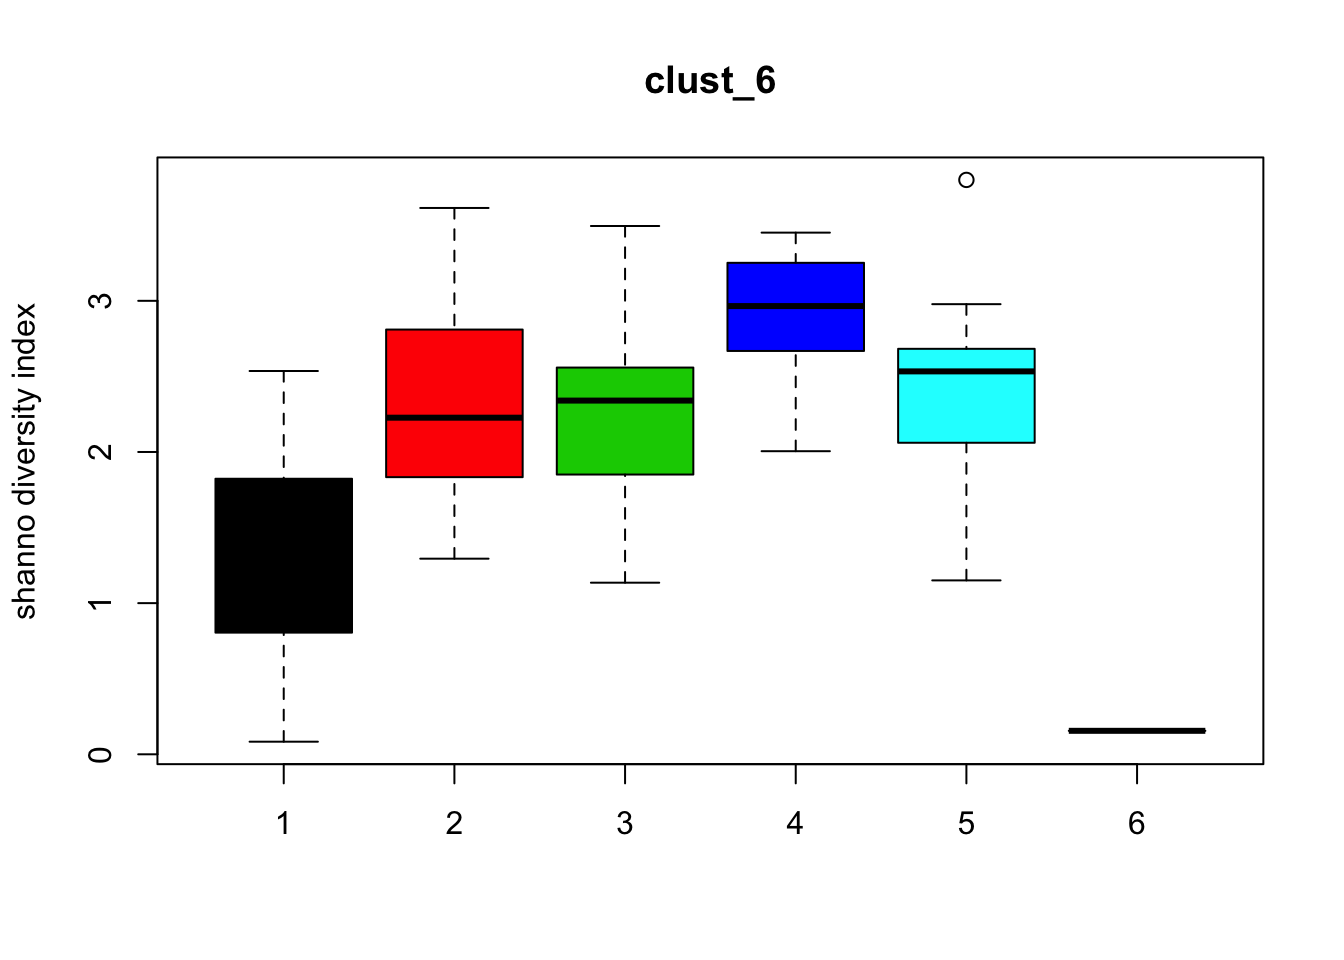
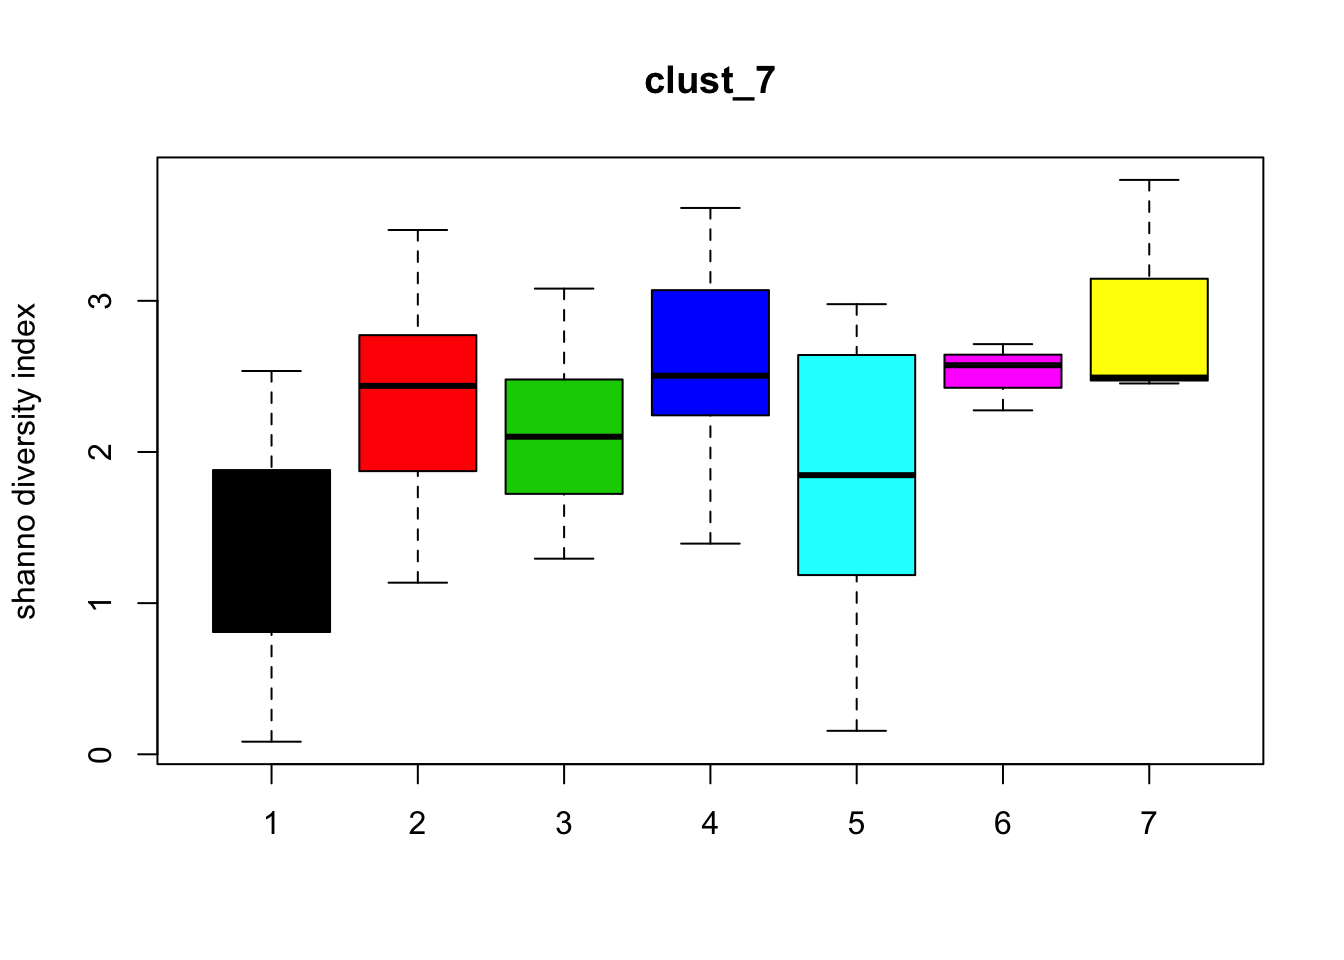
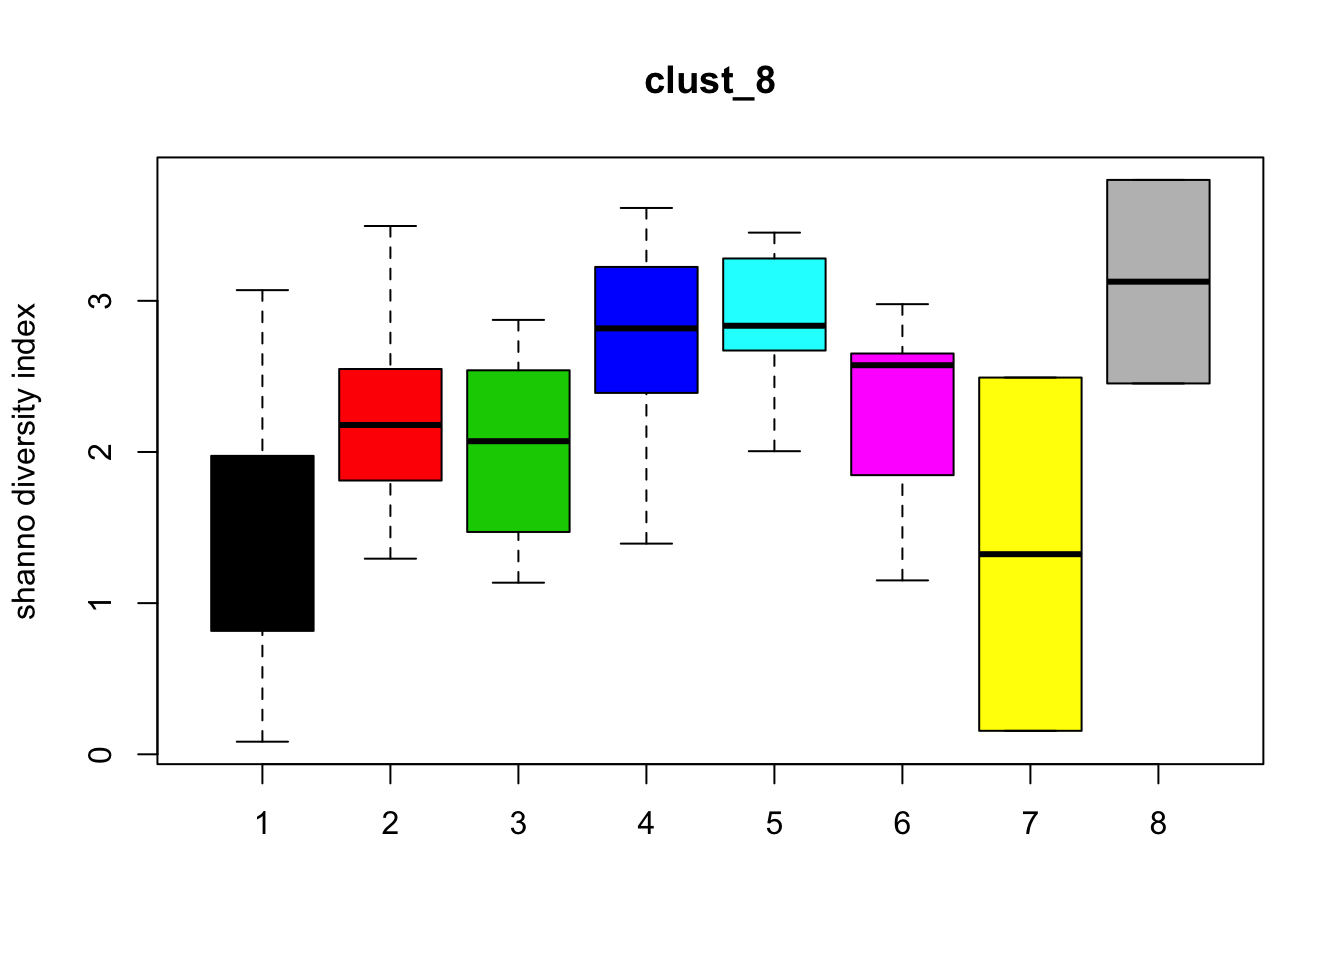
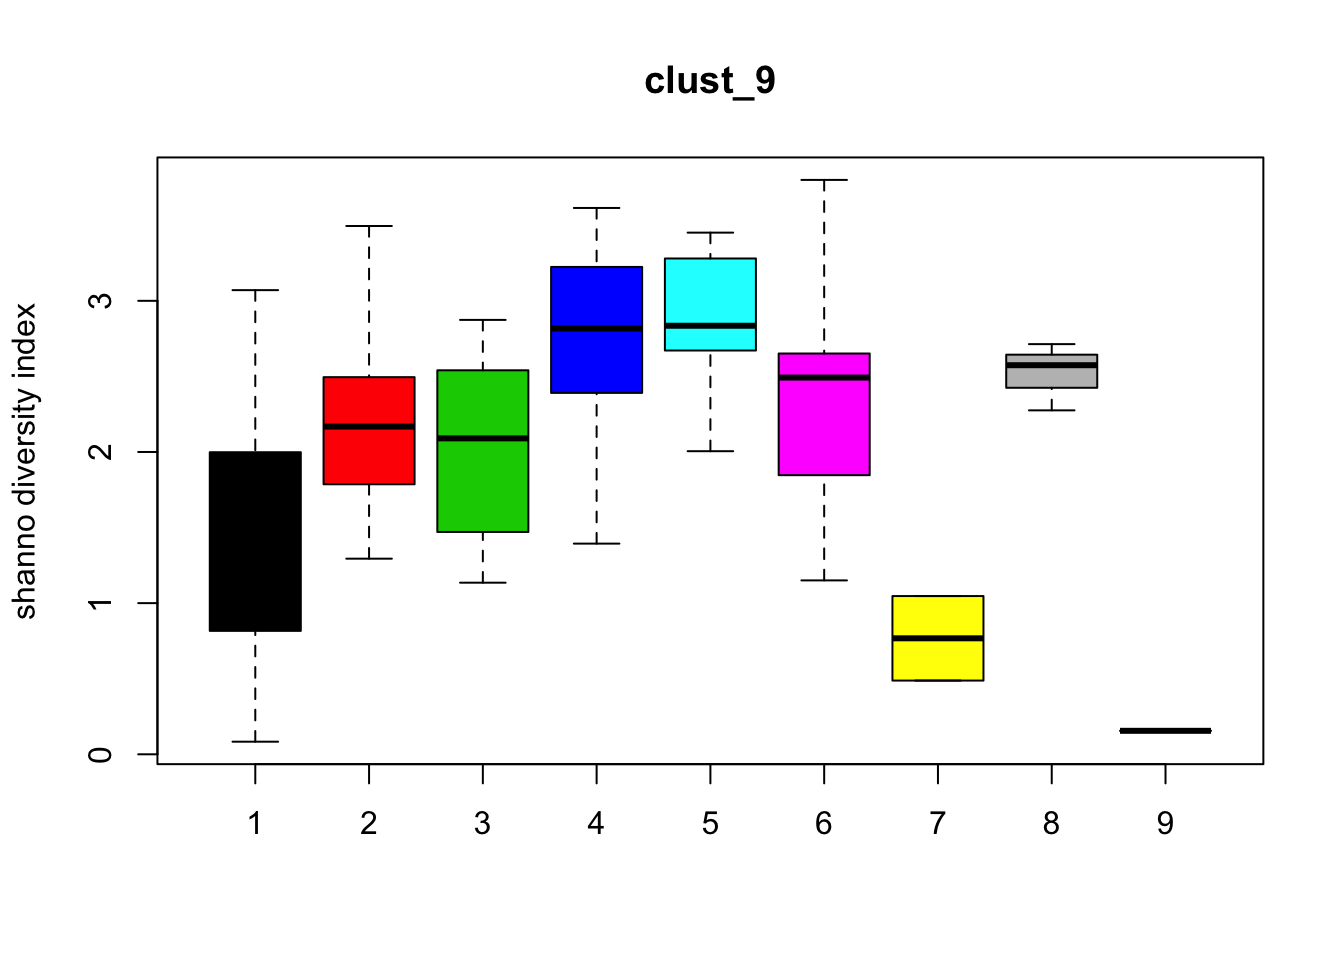
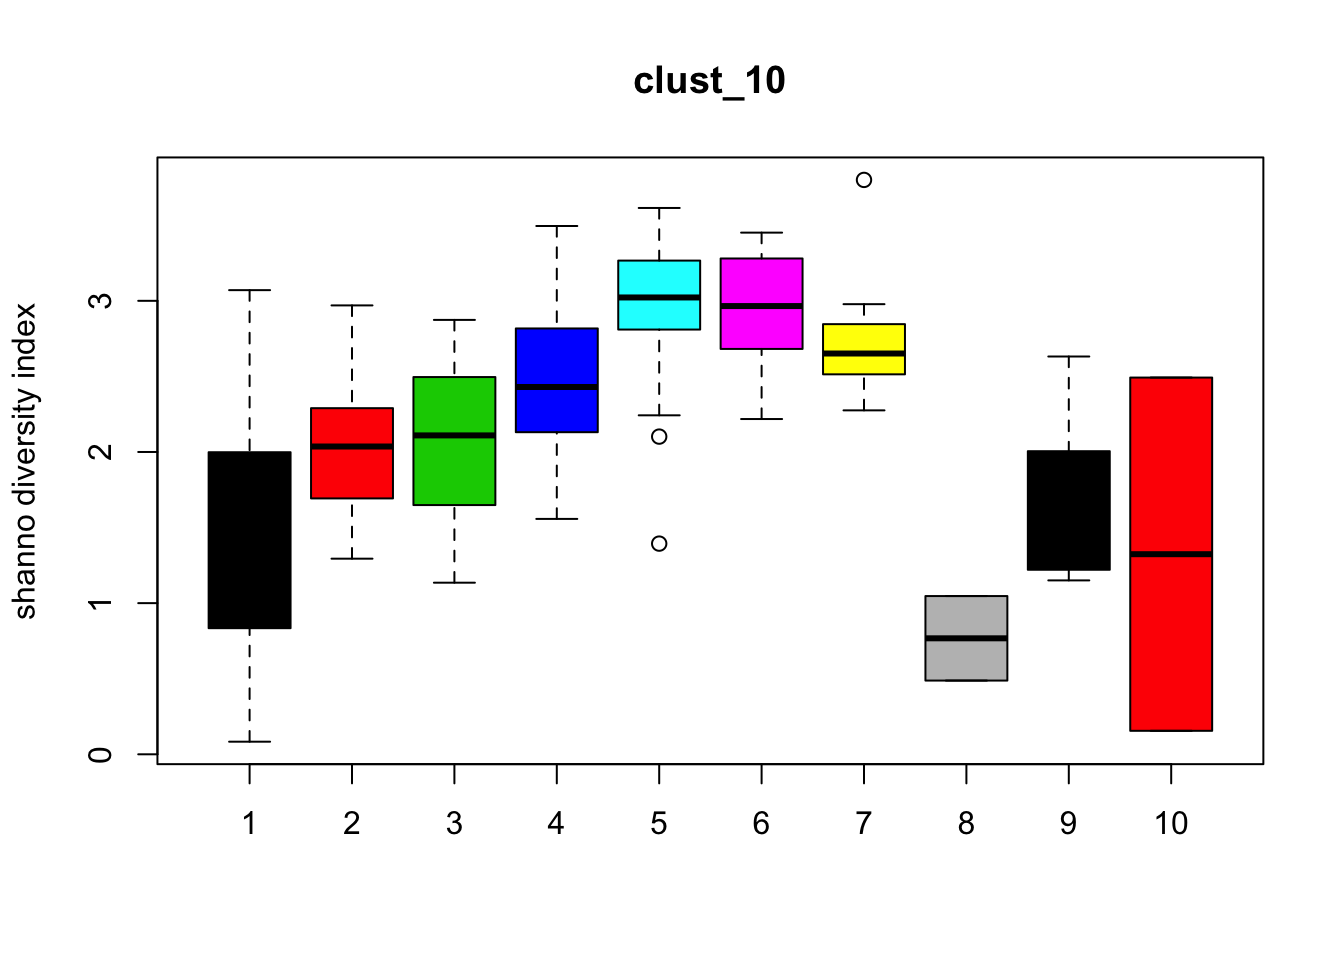
Diversity
for (i in 1:length(clust_fit_membership)) {
  cl <- factor(clust_fit_membership[[i]])
  mat <- t(MRcounts(MRobj,norm=FALSE,log=FALSE))
  H <- diversity(mat,index="shannon")
  boxplot(H~cl, ylab=paste("shanno","diversity index"), col=1:length(levels(cl)),
          main = names(clust_fit_membership)[i])
}
Session information
R version 3.4.1 (2017-06-30)
Platform: x86_64-apple-darwin15.6.0 (64-bit)
Running under: macOS High Sierra 10.13

Matrix products: default
BLAS: /Library/Frameworks/R.framework/Versions/3.4/Resources/lib/libRblas.0.dylib
LAPACK: /Library/Frameworks/R.framework/Versions/3.4/Resources/lib/libRlapack.dylib

locale:
[1] en_US.UTF-8/en_US.UTF-8/en_US.UTF-8/C/en_US.UTF-8/en_US.UTF-8

attached base packages:
[1] parallel  stats     graphics  grDevices utils     datasets  methods
[8] base

other attached packages:
 [1] vegan_2.5-1          lattice_0.20-35      permute_0.9-4
 [4] CountClust_1.4.1     ggplot2_2.2.1        metagenomeSeq_1.21.1
 [7] RColorBrewer_1.1-2   glmnet_2.0-16        foreach_1.4.4
[10] Matrix_1.2-14        limma_3.34.9         Biobase_2.38.0
[13] BiocGenerics_0.24.0  dplyr_0.7.4          kableExtra_0.8.0
[16] knitr_1.20

loaded via a namespace (and not attached):
 [1] httr_1.3.1         viridisLite_0.3.0  gtools_3.5.0
 [4] assertthat_0.2.0   stats4_3.4.1       yaml_2.1.19
 [7] slam_0.1-43        pillar_1.2.2       backports_1.1.2
[10] glue_1.2.0         digest_0.6.15      rvest_0.3.2
[13] colorspace_1.3-2   picante_1.6-2      cowplot_0.9.2
[16] htmltools_0.3.6    plyr_1.8.4         pkgconfig_2.0.1
[19] scales_0.5.0       gdata_2.18.0       git2r_0.21.0
[22] tibble_1.4.2       mgcv_1.8-23        nnet_7.3-12
[25] lazyeval_0.2.1     magrittr_1.5       evaluate_0.10.1
[28] nlme_3.1-137       MASS_7.3-50        gplots_3.0.1
[31] xml2_1.2.0         tools_3.4.1        hms_0.4.2
[34] matrixStats_0.53.1 stringr_1.3.0      munsell_0.4.3
[37] cluster_2.0.7-1    bindrcpp_0.2.2     compiler_3.4.1
[40] caTools_1.17.1     rlang_0.2.0        grid_3.4.1
[43] iterators_1.0.9    rstudioapi_0.7     bitops_1.0-6
[46] rmarkdown_1.9      boot_1.3-20        gtable_0.2.0
[49] codetools_0.2-15   flexmix_2.3-14     reshape2_1.4.3
[52] R6_2.2.2           bindr_0.1.1        rprojroot_1.3-2
[55] maptpx_1.9-3       KernSmooth_2.23-15 readr_1.1.1
[58] ape_5.1            modeltools_0.2-21  stringi_1.2.2
[61] SQUAREM_2017.10-1  Rcpp_0.12.16
This R Markdown site was created with workflowr